Evaluate Results
Numbers
Six Key Metrics
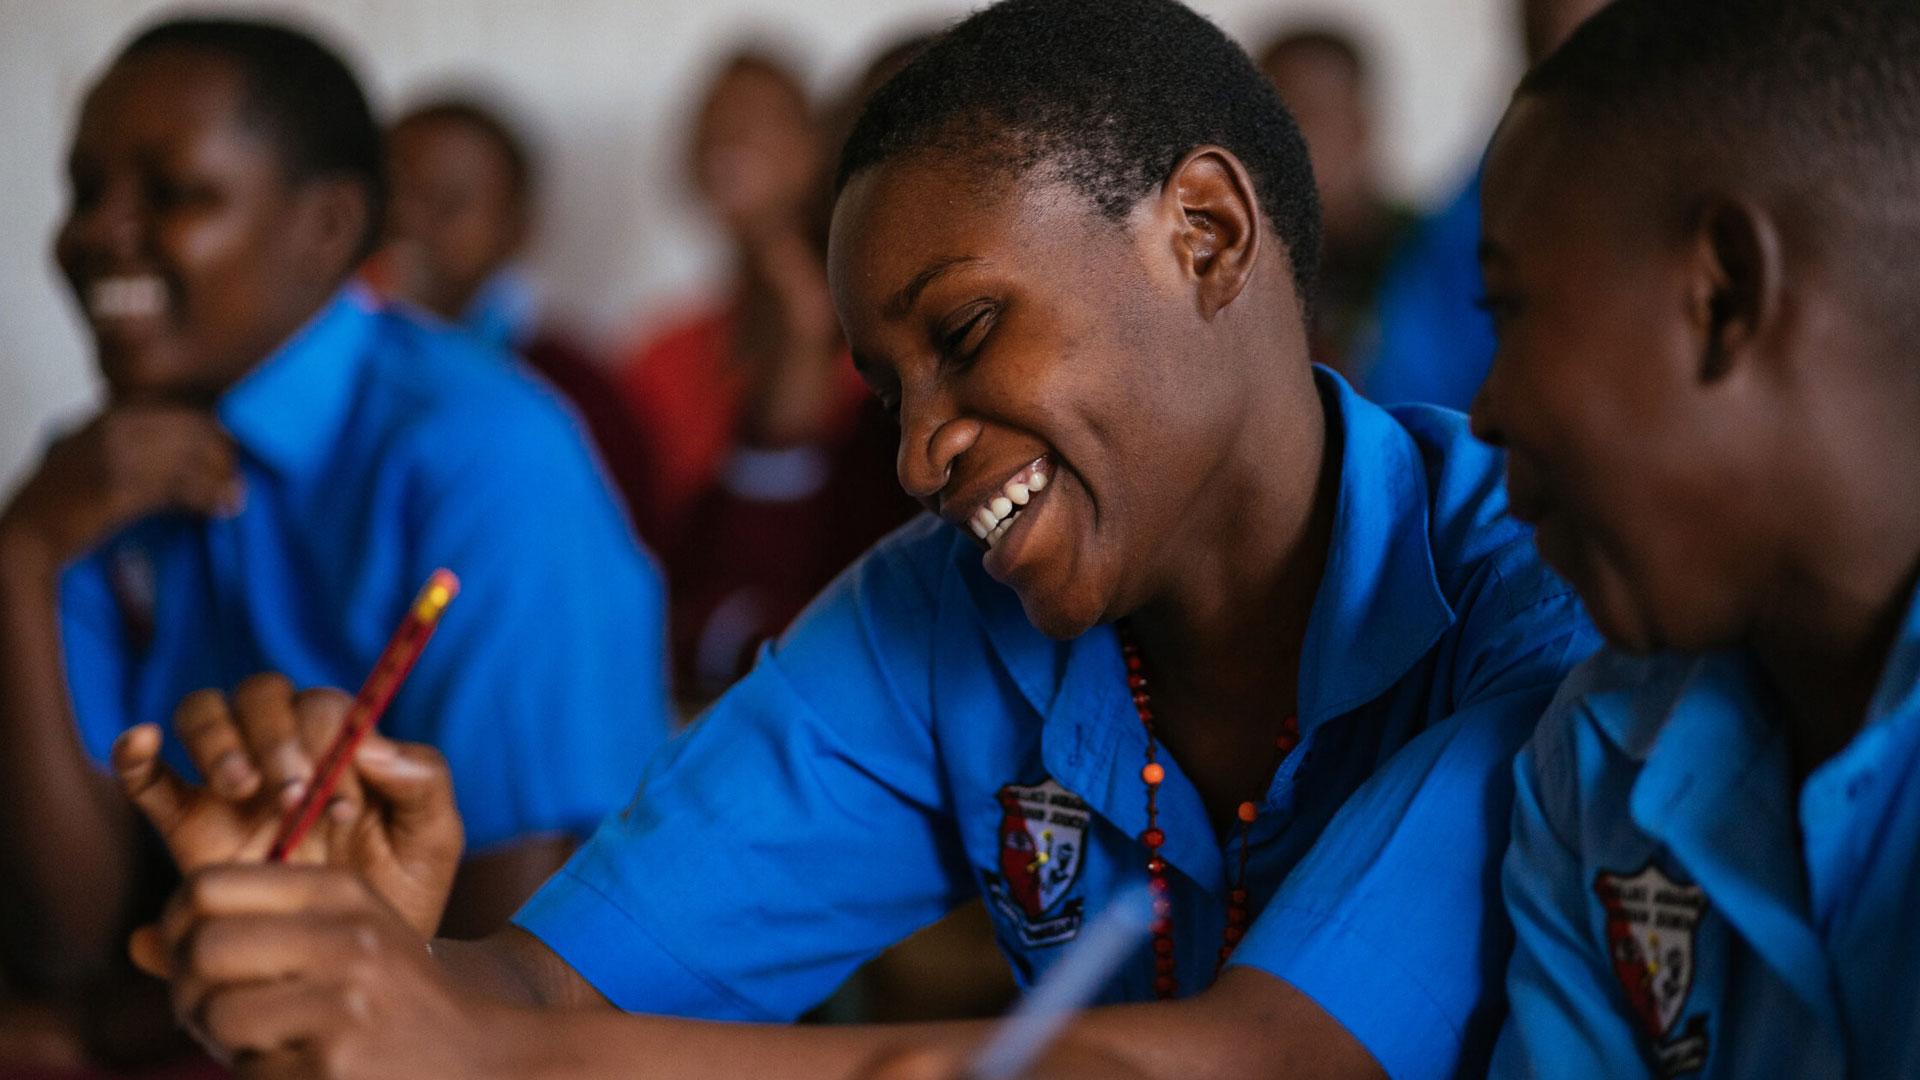
We measure key metrics each year to assess the quantity, quality, and efficiency of our programs.
12.1m
Students Impacted
12,083,667 students were impacted by Christ-centered education. This is a 44% growth from FY24.
- 12.1m in 2024
- 8.4m in 2024
- 6.5m in 2023
+50%
Core School Growth
Increase in number of Core Schools:
- 2025: 3,562 (+50% YOY)
- 2024: 2,371 (+34% YOY)
- 2023: 1,774 (+127% YOY)

+30%
Exposure to God’s Word
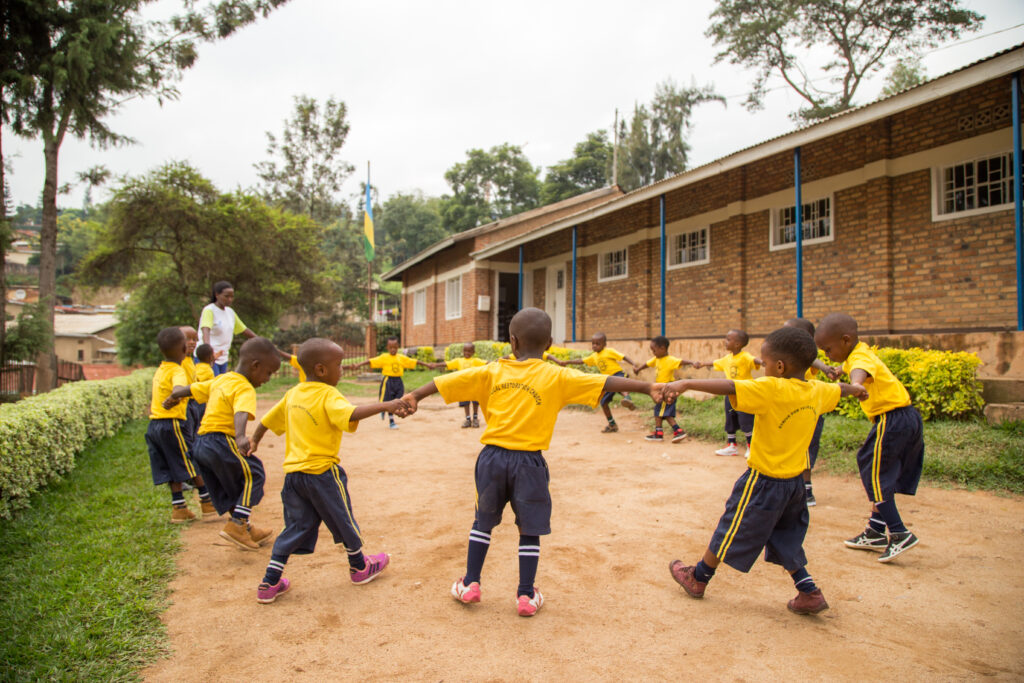
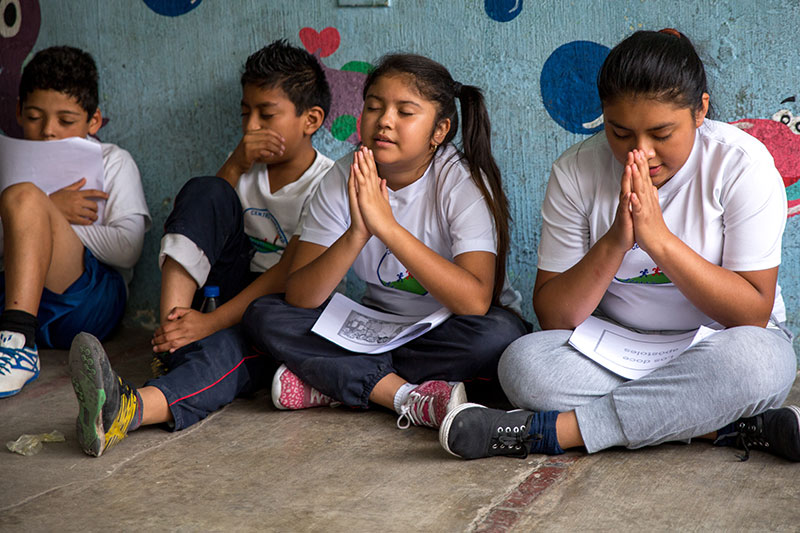
30% increase in current Core Schools over baseline with visible evidence of:
- Discipleship Clubs
- Corporate worship
- Scheduled devotions
- Christ-centered activities
96.7%
Exam Scores
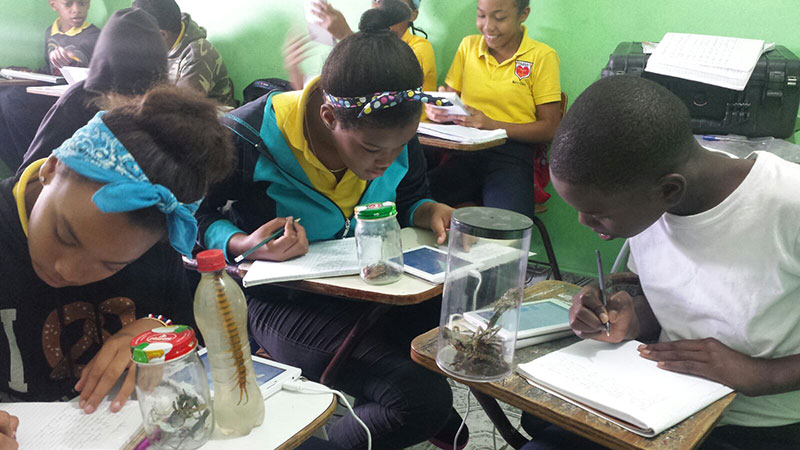
Percentage of students achieving a certain threshold on the national exam in Core Schools vs. national average.
- 96.7% Edify Core Schools
- 87% national average

$1.50
Cost per student impacted
Cost per student = total Edify expenses divided by total students impacted.
- 2025: $1.50
- 2024: $1.76
- 2023: $1.95
$1.8m
Recycled Capital
In FY25, Edify deployed $1,817,340 in net new capital, resulting in $8,435,557 in total loans to schools due to the recycling of repayments.